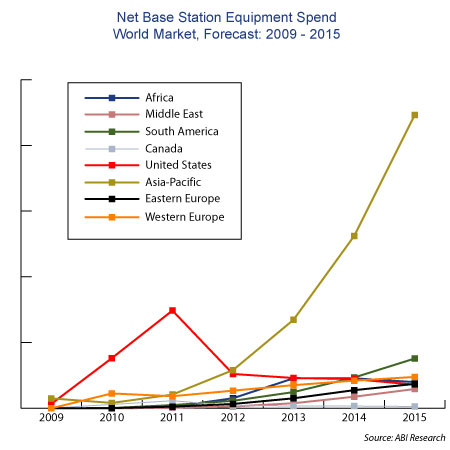
Here’s ABI’s “Featured Chart of the Week” (aren’t these analysts crazy with their chart of the week comps? I hear the compiler of the “Magic Quadrant of Magic Quadrants – Net of Declared Consulting Fees” chart was gutted to miss out.)
Anyway, if this chart is accurate, it says it all really. It’s called Net Base Station Equipment Spend, World Market Forecast, 2009-2015, as you can see. (Click on it for bigger image)


